Data Pipelines

The most challenging aspect of effective data analysis is often getting your data into a usable structure. Learn how Dead Reckoning can provide customized, stable solutions for your use case.

Predictive Analytics

Apply a principled model design approach that maximizes opportunities for informed decision-making given your data, goals, and resources

Customized Dashboards & Reports

Leverage your data processing and modeling pipelines to generate dashboards and reports that deliver actionable insights and communicate key information to stakeholders

What’s in a Name?

Learn more about Dead Reckoning as an approach to navigating data science challenges and opportunities

The Dead Reckoning Philosophy

From the blog

Recent posts

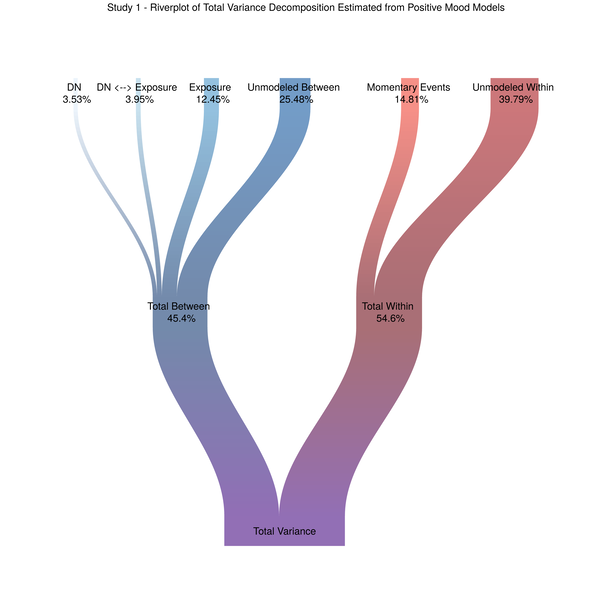
Visualizing Variance in Multilevel Models Using the Riverplot Package

By Matthew Barstead, Ph.D. on January 19, 2019

Spurred on by Alex Shackman, I have been working to figure out a good way to visualize different sources of variation in momentary mood. The most common way of visually depicting variance decompositions from the sort of multilevel models we used to analyze our data is a stacked bar plot. So that seemed like a good place to start. Figure 1. Stacked Barplot of Model Variance Decomposition Now, choosing a color scheme that screams “HI I’M A COLOR!

Continue reading

Power Analysis for an Unconditional Growth Model Using a Selected Sample

By Matthew Barstead, Ph.D. on June 7, 2018

(Updated: 2020-12-31) Problem Statement Determine whether, given what we know about the target phenomenon, a sample of 120 subjects, measured at three time points is sufficient to detect linear change in an unconditional growth model. A trained phlebotomist once described her experience trying to pierce a patient’s vein with her needle as akin to “Trying to use a toothpick to stick a wet noodle covered by a piece of wax paper.

Continue reading

Gaussian Process Imputation/Forecast Models

By Matthew Barstead, Ph.D. on May 21, 2018

(Updated: 2020-12-31) Problem Statement Create a forecast model using only the information available in a single, univariate time series. The Past is Prologue Sometimes the only data we have to predict a particular phenomenon are previous measurements of the target variable we hope to forecast. Using the past to predict the future means that we assume prior trends will continue into the forecast window. Absent other information and all else being equal, making a past is prologue assumption is not a terrible decision in many cases.

Continue reading